

According to the National Association of Realtors®, there were just 4.06 million home sales nationally in 2025, virtually unchanged from 2024 and far below the 20-year average of more than 5 million. Sales activity has shown little sign of rebounding. In March 2026, NAR reported existing home sales at a seasonally-adjusted annual rate of under 4 million. First-time home buyers make up a record small share of home sales and buyers are waiting longer to get into the market.
We keep hearing there is significant pent-up demand in the housing market and all we need is more inventory and improved affordability to unleash this demand. While it is true that home sales activity has been significantly lower than long-term averages in recent years, the current slump follows three years of higher-than average transactions fueled by low interest rates and COVID-induced demand. How much pent-up demand is there really in the housing market? And is the pent-up demand part of a cycle or has something structural changed in the U.S. housing market?
Measuring Pent-Up Demand for Homeownership
One way to look at this issue of pent-up housing demand is to examine “typical” homeownership rates and compare them to current rates. For the sake of argument, let’s use 2000 as our typical, baseline year. In the first quarter of 2000, according to the U.S. Census Bureau, the overall homeownership rate in the U.S. was 67.5%. Just over 40% of households headed by someone under age 35 were homeowners, and homeownership rates generally increased with age.
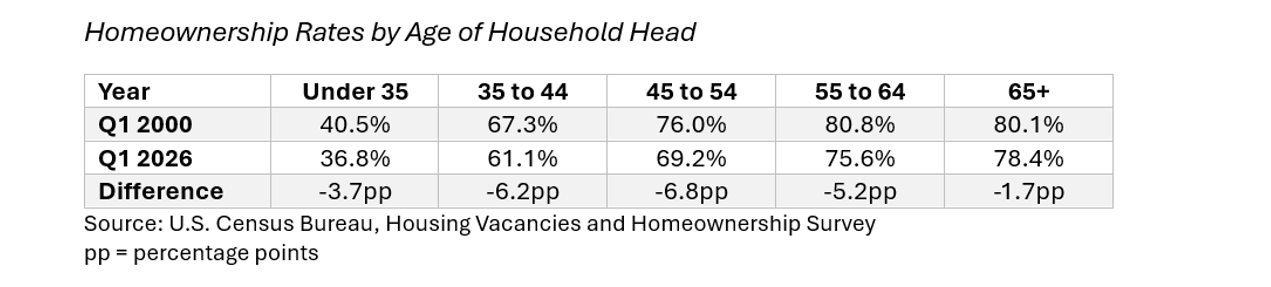
Fast forward to the first quarter of 2026, the overall homeownership rate is 65.4% and rates are lower—in some cases, much lower—across all age groups. For example, in 2000, 40.5% of households headed by someone under age 35 were homeowners, compared to only 36.8% today. The homeownership rate for households aged 35 to 44 was 67.3% in 2000, while it is just 61.1% today, a 6.2 percentage point gap. The biggest deficit is actually among 45-to-54 year olds, where the homeownership gap is 6.8 percentage points.
Lower homeownership rates among younger people is perhaps not surprising. We hear often about how challenging it has been for Millennials to get a foothold in the housing market. (The oldest Millennial is now 45 years old.) But homeownership rates among Gen X’ers (those between the ages of 46 and 61) are also much lower than they were for their counterparts back in 2000.
Why are homeownership rates lower now than they were in 2000?
The key reason homeownership rates are lower is that overall purchasing power is lower relative to 2000. Since 2000, home prices have grown almost twice as fast as incomes. In 2000, the median home price was around 3.5 times the median income. That ratio nationally has increased to about 5 and in many markets, it exceeds 6 or 7.
Millennials in 2026 face a very different financial reality than the 30- and 40-year-olds of 2000. According to the Federal Reserve’s Survey of Consumer Finances, just over a quarter of people under age 35 (26.0%) had student loan debt in 2001, compared to 40.1% in 2022 (which is the latest data available). Among 35 to 44 year olds, the share has increased from 11.9% in 2001 to 34.1% in 2022. Higher debt burdens make it more difficult to save for a downpayment and qualify for a mortgage.
Delayed life milestones are also a factor in lower homeownership rates. Compared to earlier generations, Millennials are putting off marriage and childbearing, two big triggers for home buying. They are remaining renters longer and as such are exposed to rent inflation longer, making it that much more difficult to save to buy a home.
Gen X’ers have lower homeownership rates than Baby Boomers did at their age for a couple of different reasons. First, Gen X homeowners were the ones most impacted by the foreclosure crisis and housing market collapse in 2008, with the median housing equity dropping for this group by 43% between 2007 and 2010. A significant portion of the Gen X population simply never re-entered the housing market.
At the same time, this group is also facing unique financial constraints. Often referred to as “the sandwich generation”, Gen X’ers are often simultaneously supporting young adult children and helping aging parents financially. These financial pressures can make homeownership harder to attain.
Overall, while the desire for homeownership remains high, the path has gotten more difficult for many households.
How many “missing” homeowners are there?
If homeownership rates today matched 2000 levels, there would be roughly 984,000 more homeowners under age 35 than there are today. We would have 1.5 million more homeowners headed by someone aged 35 to 44 and another 1.5m homeowners headed by someone aged 45 to 54.
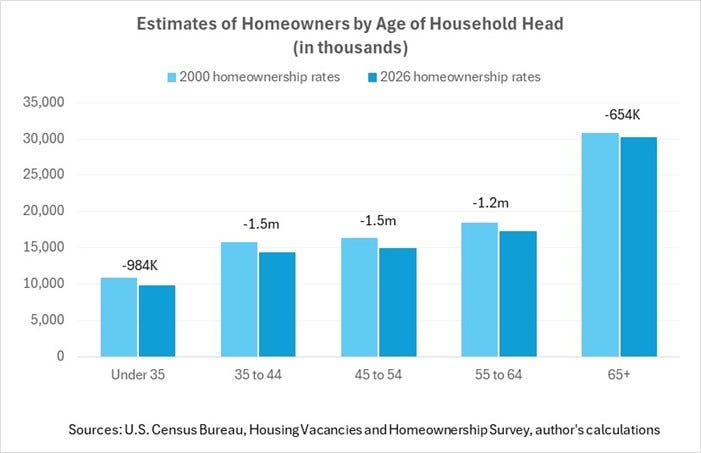
Overall, if 2026 homeownership rates matched 2000 levels across age groups, we would have more than 5.7 million more homeowners than we do today. This figure could actually understate the number of “missing” homeowners in the U.S. since it is based on households, and not people, and does not take into account lower household formation rates.
The Takeaway
The gap between current and historical homeownership rates suggests the housing market slowdown is not simply cyclical and the pent-up demand for homeownership is not going to be unleashed all at once, even if affordability improves and inventory expands. Millions of households who might once have bought a home remain on the sidelines, constrained by financial pressures, debt burdens, and delayed household formation. The result is not just fewer home sales, but a reshaping of who has been able to build wealth through homeownership and when.
The data suggest that there is, indeed, significant pent-up demand for homeownership. But this demand is unlikely to be unleashed all at once, even if mortgage rates fall and inventory improves. For many households, the barriers to homeownership are no longer simply cyclical challenges. Instead, they reflect deeper structural changes in affordability, household finances, and the economics of homeownership itself.